This site is in development. Projects marked Planned aren't live yet.

Independent lab building systems that analyze complex processes across multiple disciplines, providing data-driven insights and spatial intelligence.

Earth

Data center build-out

Where data centers are being built, how construction progresses in satellite imagery, site statistics, and a scorecard of each company's ecological and community stewardship.

Where
United States
Data
Aerial and satellite imagery
Status
Planned

Land cover change

High-resolution land cover change for communities: construction in flood zones, tree canopy cleared for development, and farmland redeveloped versus infill.

Where
Pilot in Washington County, Tennessee
Data
NAIP and Sentinel-2
Status
Planned

Species explorer

Species migration over time, and a park-by-park view: pick a park to see what has been observed there, how often, and what kinds.

Where
Parks across the United States
Data
iNaturalist
Status
Planned

Fire impacts

What fire does to built infrastructure and the natural environment, measured from satellite imagery.

Where
To be chosen
Data
Sentinel-2 and Landsat 8
Status
Planned

Tidal visualization

How often the tide runs high, from floods, storm surges and moon tides, counted at gauges in places known to flood more regularly over time, to show the sea rising in heat maps and charts.

Where
Baltimore, New York, Charleston, Virginia Beach, Ocean City and more
Data
NOAA tide gauges and the NWS
Status
Planned

Snowfall and rainfall

After a storm, the available precipitation data crunched into beautiful maps of the significant snow and rain it brought.

Where
To be chosen
Data
Available precipitation data
Status
Planned

Why Fall Line

  1. On a map The Atlantic Seaboard Fall Line Where the hard rock of the Piedmont meets the softer sediments of the Atlantic Coastal Plain, rivers drop over falls and rapids. Boats coming up from the coast had to stop there, mills ran on the falling water, and cities grew along the line: Trenton, Philadelphia, Baltimore, Washington, Richmond, Columbia, Augusta, Macon and Columbus among them.
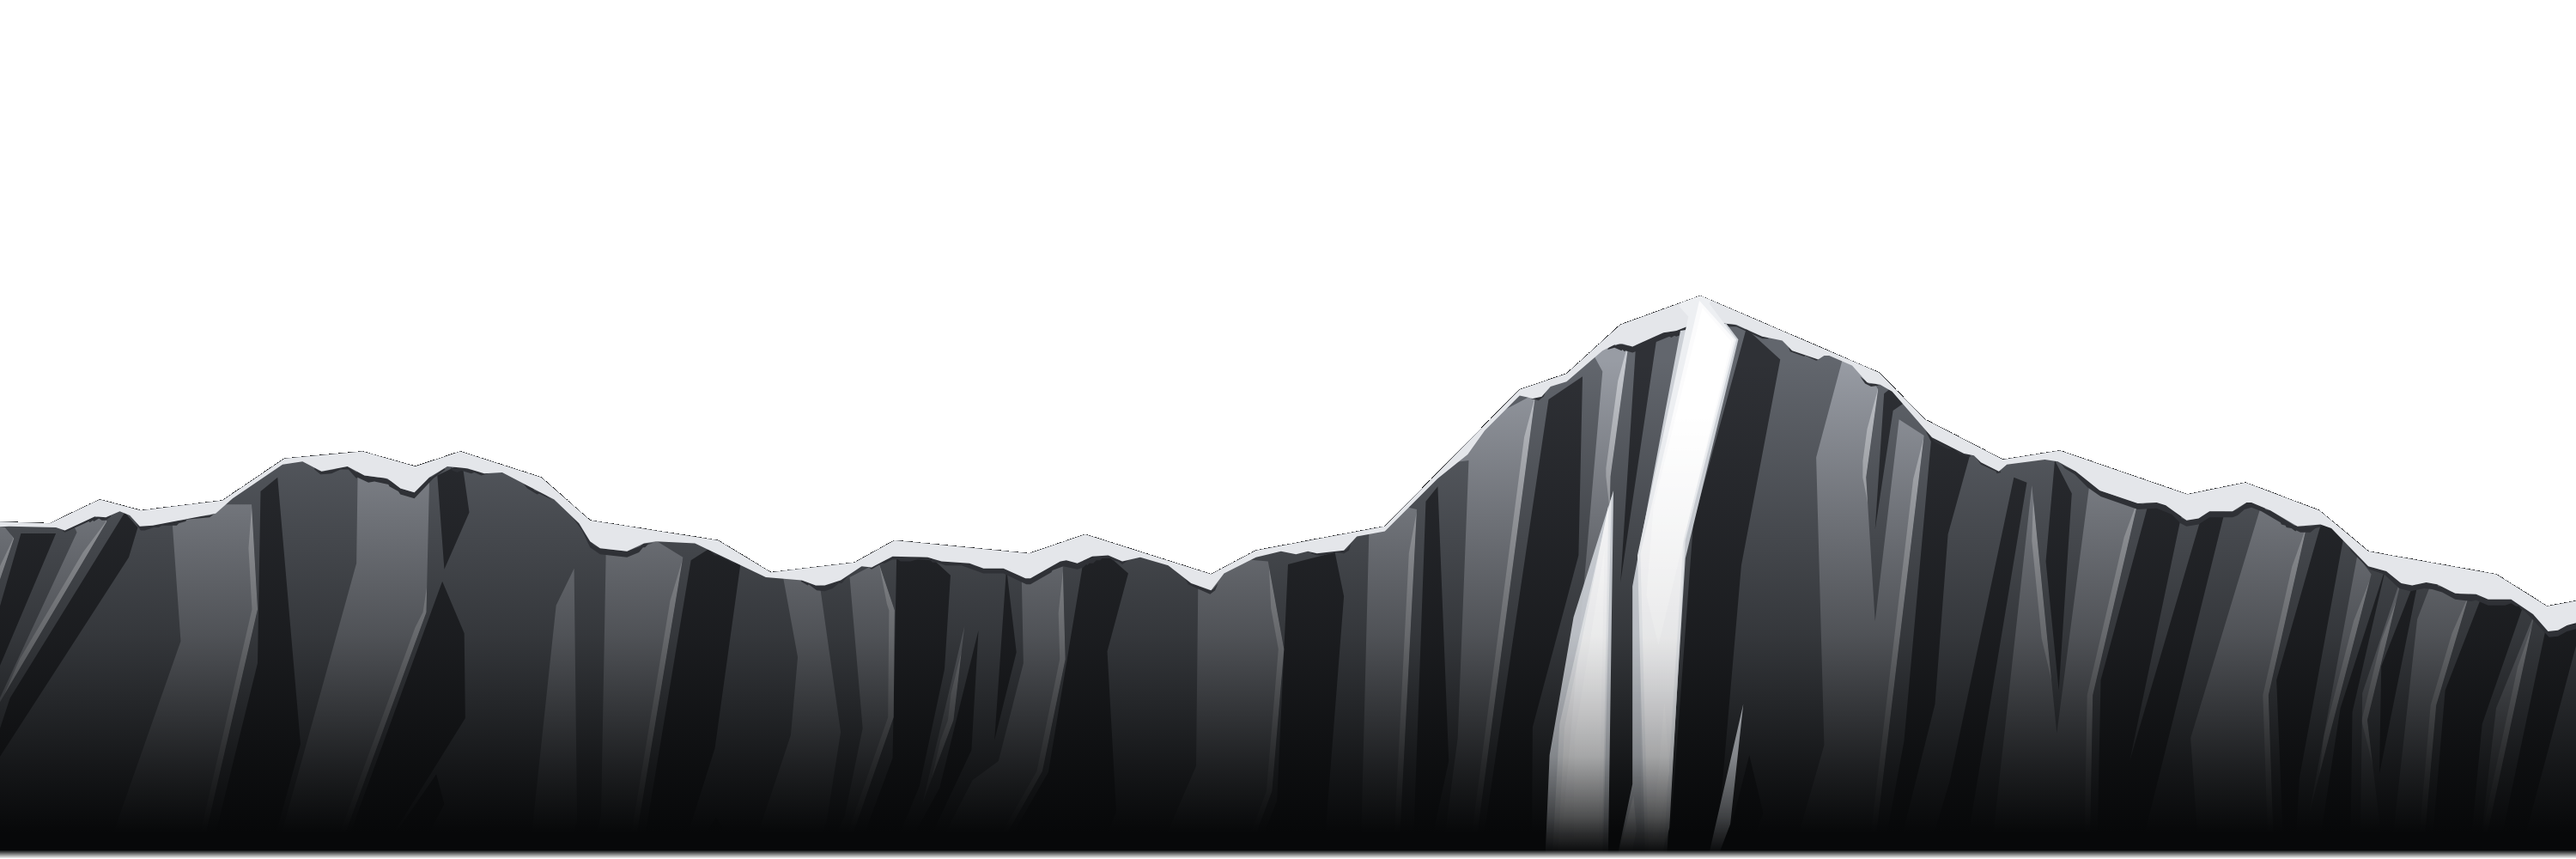
  2. On a mountain The line of steepest descent To a skier, the fall line is the most direct way down a slope: the path a ball would roll if you let it go. The white couloir on the face of the mountain at the top of this page is one.
  3. In a model Where the water goes Water takes the fall line too. Watershed tools in GIS give every cell of an elevation model the direction of its steepest drop, and from those directions come the streams, the watershed boundaries and how much land drains through each point.
  4. In the sky Orion and Lyra The stars over the range are real ones, at their catalog positions and brightness: Orion to the left of the summit and Lyra to the right. The two are too far apart in the sky for any one view to hold both, so the picture joins two views above the summit, drawn at one scale so each keeps its true size.

About

Fall Line Research is a lab that focuses on GIS, spatial analysis, data science and visualizations across a number of disciplines, including earth science, ecology and earth observation.

Fall Line Research is not affiliated with any other agency or organization and is run independently.